← Back to Projects

TeleCruncher
Mentored by: Next Silicon
Telemetry data processing and analytics platform
Python
Apache Kafka
Apache Spark
ClickHouse
Grafana
Kubernetes
Description
A high-throughput system for processing and analyzing telemetry data from distributed systems. Handles millions of events per second with real-time aggregation, filtering, and visualization. Features include stream processing, time-windowed analytics, anomaly detection, and customizable dashboards.
Team Members
Cohort: Data Science Bootcamp 2025 (Data)
Responsibilities:
Implement a gRPC service to receive telemetry, process it, and store the results in the database.
Research Task – GPU Telemetry Types & JSON Schema
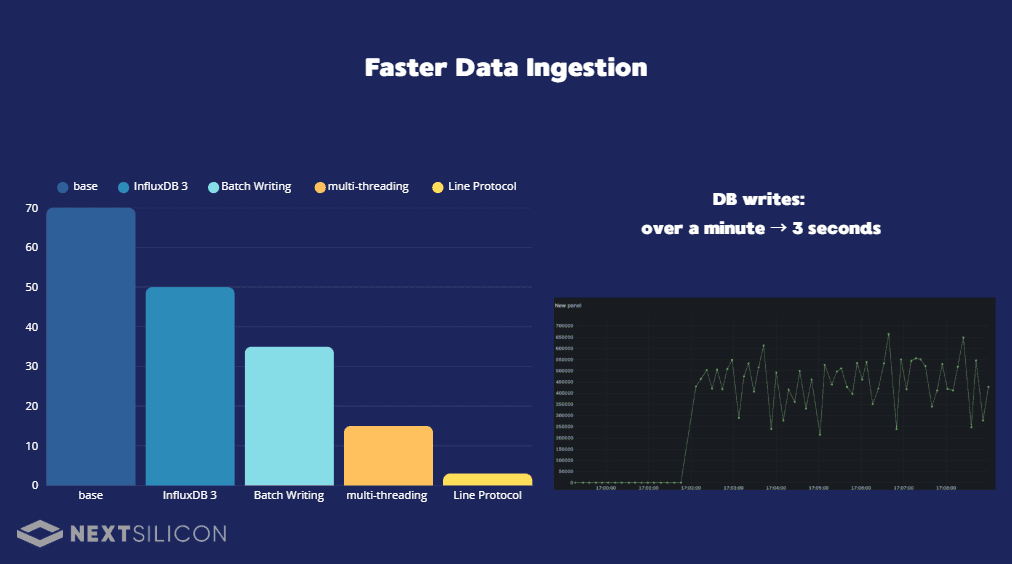
InfluxDB — Fast Telemetry Writes (Multithreading/Batch Writes/Line Protocol)
Create Composite Tag Field
Build Redis Cache for Top-K Hot Keys per Schema
Add Aggregation Tables During Write Operations
Generate telemetry frames from a CSV script by adding a mode where the generator outputs frames exactly as defined in the CSV “story” .
FastAPI + Dash/Plotly Visualization Layer
Enable zoom-in navigation by performing a fresh query to the appropriate table on every zoom action
Enable zoom-in navigation by performing a fresh query to the appropriate table on every zoom action
...and more contributions not listed here
Responsibilities:
Designed and implemented the base telemetry schema
Set up a full Docker stack to launch all services together
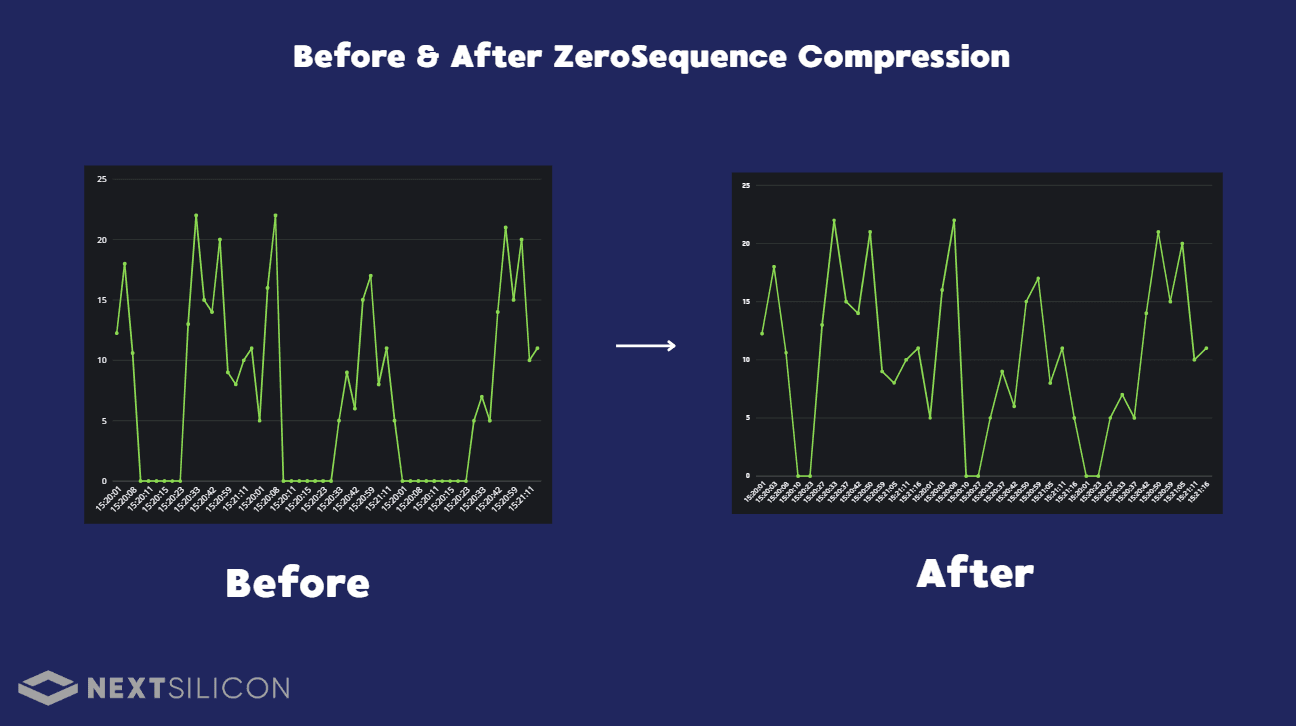
Added ZeroSequenceCompressor component and updated server-side integration
Added gpucomputeefficiency schema
Implemented Telemetry codec class
Connected the system to Grafana and verified successful integration
Implemented logging of telemetry data to the database
...and more contributions not listed here
Responsibilities:
Defined a generic schema for incoming telemetry structures, based on analysis of telemetry data received from NVIDIA GPUs.
Research: Telemetry ingestion on the server using Kafka/RabbitMQ, batching incoming data for efficient storage in InfluxDB.
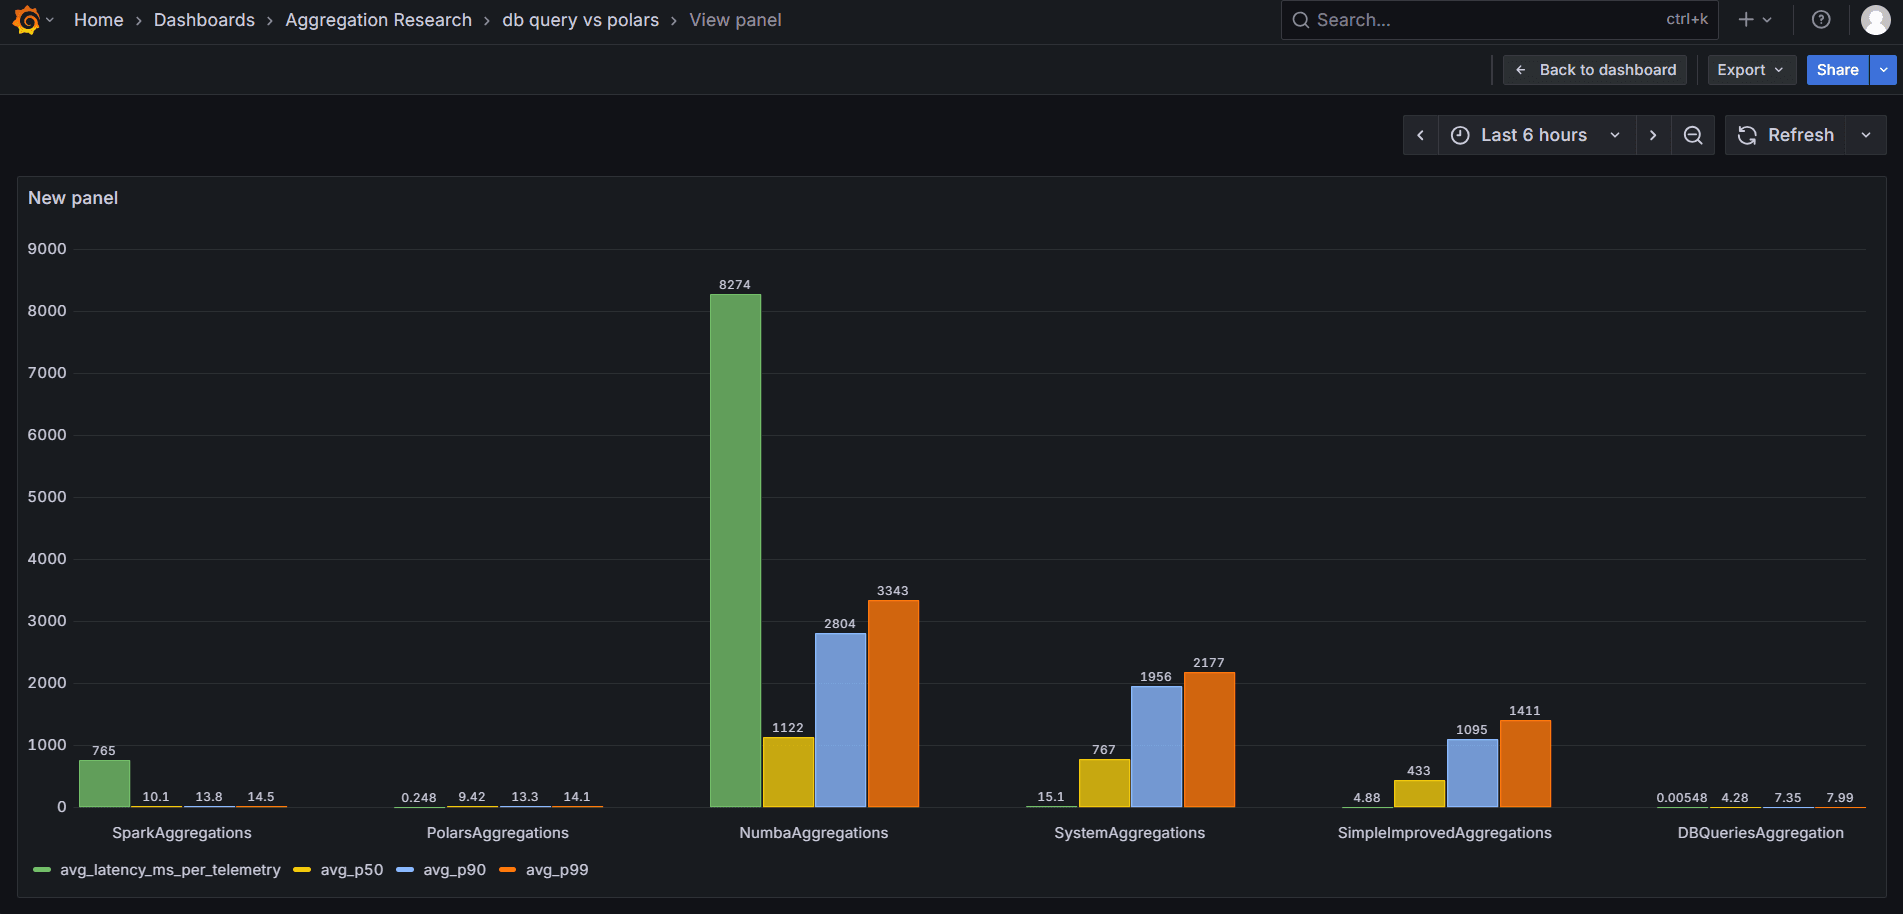
Evaluated multiple acceleration approaches — threading, Numba, Spark, and Polars — and selected the fastest solution, ultimately reducing query latency from 4.88 ms to 0.00548 ms through direct database queries for fast dashboards.
Executed complex SQL queries (JOIN, PIVOT, CTE) across multiple InfluxDB tables to aggregate raw telemetry for dashboards requiring combined metrics — such as correlating error counts with efficiency levels.
Migrated profiling data and logs into structured SQLite metrics tables, improving query performance and overall data visibility.
Integrated Grafana primarily for performance profiling and system monitoring.
Developed pytest tests for key components to validate functionality and handle important edge cases.
...and more contributions not listed here